When we perform SEO audit, checking the load speed of individual page is essential step. Leverage browser caching has always been the top of the talk in the web development community. Browser cache is the assets- images, HTML, CSS, scripts – what are stored in your hard drive from any website when you visit the website for the first time.
It helps the device to load pages so quickly than usual and helps provide a smooth browsing experience; leveraging browser cache can transform a standard website into a professional one.
What is Browser Caching
Probably, you all heard about the Browser or Web cache or simply cache during the website page speed checking. Caching means storing something in the inventory but most of the time secretly in the thought of that might come in use later.
A browser cache does almost the same thing with page’s static assets – parts of a website that do not change from visit to visit. They take those assets or pieces of web page & store them in the hard drive of your device.
Static assets include –
- Images – logos, pictures, backgrounds, etc.
- HTML
- CSS
- JavaScript
So, it plays a great role in smoothing your browsing experience in decreasing the loading time and helps to compress the page size & consume less memory while storing.
Top 3 Pages for Speed Test Checker
When it comes to the matter of web pages, speed matters. More loading speed means a better experience, and less speed means the probability of switching the website for the desired result.
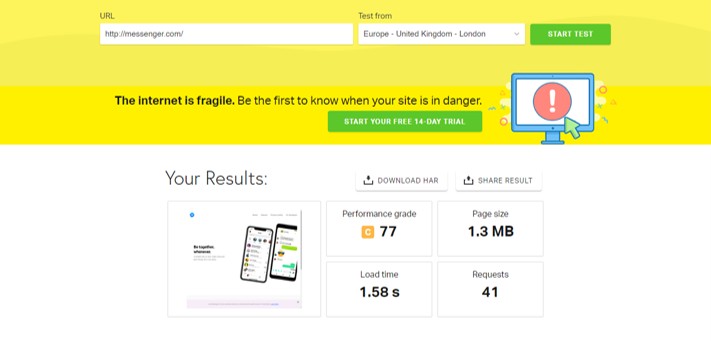
If you are an owner of a web page then you have to understand what works behind speeding / slowing up your websites. Let’s start with seeing a photo as an example-
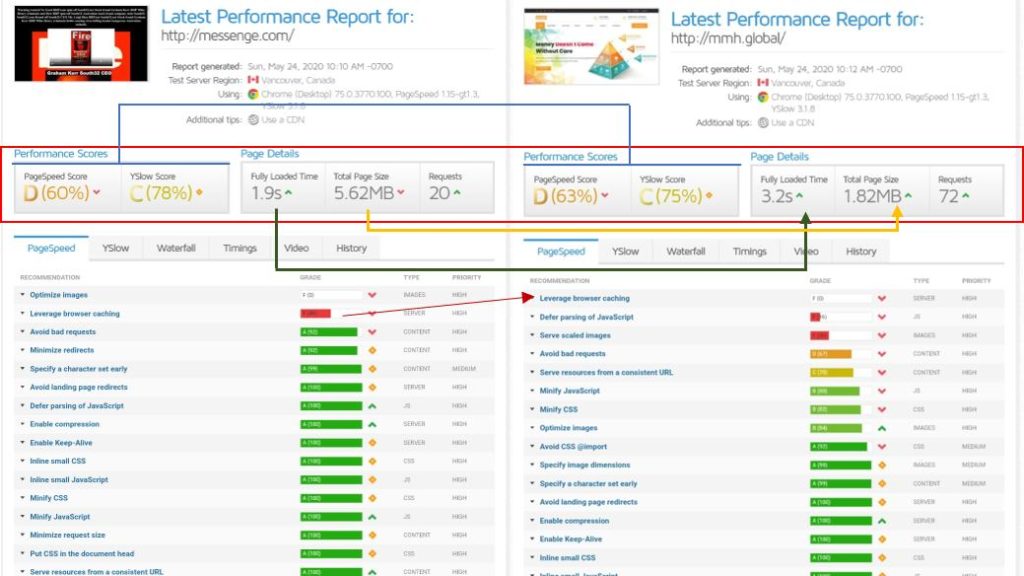
This photo shows the speed comparison & condition of two individual websites. The top red marked area shows an overall comparison. Where the blue marked (Performance score) place’s percentage is more or less similar, but things like loading speed to page size ratio are too much distinguishable.
You can see that https://messenger.com can load itself in 1.9s despite having a larger size, but https://mmh.global takes 3.2s with less page size. why this is happening?
In the photo, you can see a red arrow that shows the major difference, leverage browsing caching, between two websites. One is at 49& the other one is at 0. Other minor issues affecting too. But the leverage browsing cache is playing a major role in speeding up the website.
So, it’s necessary to know what your website needs to perform better, and for this purpose, our RND team handpicked three top website speed checker websites that can act as complementary to each other but as a whole, they can provide every analysis regarding speed related issues
Gtmetrix.com
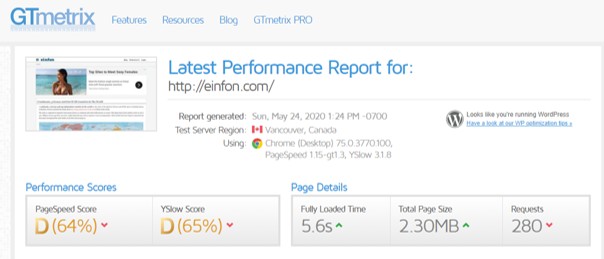
GTmetrix, the most preferred speed testing website right now. It offers most of the information with individual ratings. It’s an easily accessible website, so, if you are an official of any website, and want to know if your website needs maintenance or not.
You can simply go there & by entering your URL, you can see a specified performance score, Page details & core details– page speed, yslow, waterfall, timing, speed history. You will find more subsections under the core details part.
PageSpeed Insights
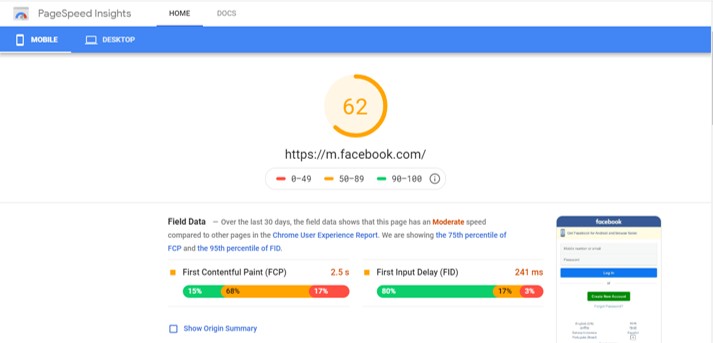
This website runs by Google, and it’s shows kind of similar reports like GTmetrix but in a different format. In their report, you can see an overall percentage at the top.
It represents the overall speed condition of the website. Then you can find five subsections in their report- Field data, original summary, Lab data, opportunities, Diagnostics.
You can find reports in the opportunity’ subsection that can directly affect your website’s speed. & other subsections will help you to understand the overall condition.
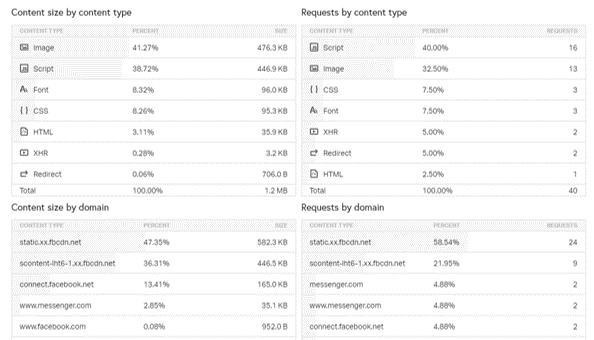
Pingdom Tool
This website does more or the same work as the other two mentioned above. But this site provides a percentage of assets/ files you have on your website that you won’t find on those two.
In the next figure, you will see what kind of percentage they show & based on that you can rearrange/ recreate/ redevelop your website to make it light or more optimized.
SEO Benefits of Leverage Browser Caching in WordPress
The browsing experience starts with writing the URL into the address bar to find the desired outcome. But when our dopamine rises high in the loading part. Questions arise on our mind- will this page take the load? Why is this page taking too much time to load? & if you are a portable data user i. e. Verizon or Vodafone the question might look like this- this page might take too much data.
The root of all the question’s answers lies inside browser caching. If the caching related setups are utilized & placed properly then your reactions might be these & which are also the SEO benefit of the Leverage Browser Caching-
- The page will be so fast & smooth!
- it has load sooner it might consume less data etc.
- Will improve its performance score on speed checker websites
Why Is Using Leverage Browser Caching in Websites So Important?
Benefits of Leverage browsing caching are mostly performance & speeding up related. However, we can put it in this way-
- The primary benefit is speeding up the website because static files will serve from your browser
- Saves internet data of website visitors
- Saves bandwidth of the website server and decreases the load of the server
- Decreases HTTP requests
On the whole, proper usages of leverage browsing caching on the website can take your website’s speed into another level & can provide a great user experience.
How to fix leverage browser caching in Linux hosting with cPanel & Advantages of different tags
Fixing leverage browser caching in cPanel is so easy, and in fact, you can do it by yourself in just a few minutes. Follow these instructions-
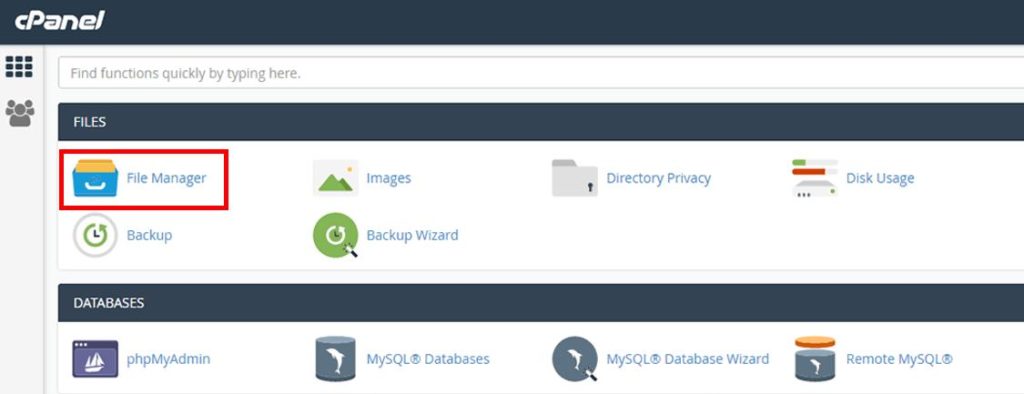
- Login to cPanel.
- Select the ‘File Manager’ menu under the file section
Tick the checkbox ‘Show Hidden Files’ and click “Save” button.
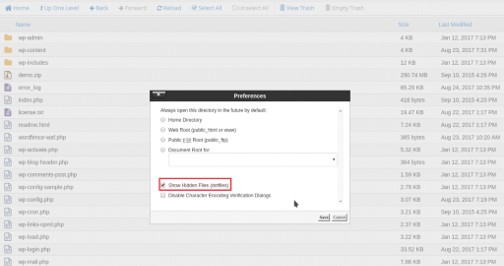
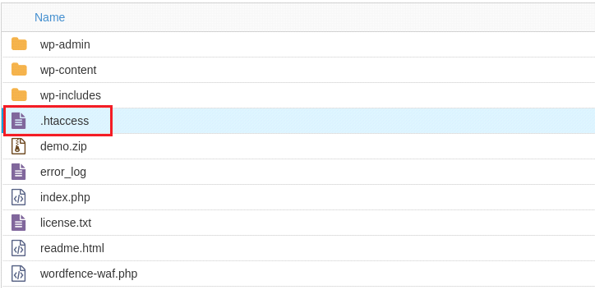
4) Find and edit the file ‘.htaccess’ under public_html.
# Enable Compression
< IfModule mod_deflate.c>
  AddOutputFilterByType DEFLATE application/javascript
  AddOutputFilterByType DEFLATE application/rss+xml
  AddOutputFilterByType DEFLATE application/vnd.ms-fontobject
  AddOutputFilterByType DEFLATE application/x-font
  AddOutputFilterByType DEFLATE application/x-font-opentype
  AddOutputFilterByType DEFLATE application/x-font-otf
  AddOutputFilterByType DEFLATE application/x-font-truetype
  AddOutputFilterByType DEFLATE application/x-font-ttf
  AddOutputFilterByType DEFLATE application/x-javascript
  AddOutputFilterByType DEFLATE application/xhtml+xml
  AddOutputFilterByType DEFLATE application/xml
  AddOutputFilterByType DEFLATE font/opentype
  AddOutputFilterByType DEFLATE font/otf
  AddOutputFilterByType DEFLATE font/ttf
  AddOutputFilterByType DEFLATE image/svg+xml
  AddOutputFilterByType DEFLATE image/x-icon
  AddOutputFilterByType DEFLATE text/css
  AddOutputFilterByType DEFLATE text/html
  AddOutputFilterByType DEFLATE text/javascript
  AddOutputFilterByType DEFLATE text/plain
< /IfModule>
The mod_deflate module provides the DEFLATE output filter that allows output from your server to be compressed before being sent to the client over the network.
‘Simply, compress content before it is delivered to the client.’
gzip files scan for duplicate data strings. If the program encounters these recurring sequences, it replaces them with a link to the string that first appears. The length of these sequences is usually limited to 32,000 bytes. If a character string does not appear in the previous 32,000 bytes, it is stored (without being compressed) in the gzip file that receives the .gz ending.
—– — —
gzip files scan for duplicate data strings. If the program encounters these recurring sequences, it replaces them with a link to the string that first appears. The length of these sequences is usually limited to 32,000 bytes. If a character string does not appear in the previous 32,000 bytes, it is stored (without being compressed) in the gzip file that receives the .gz ending.
‘Simply, it reduces the size of page through compression’
—
To leverage your browser’s caching generally means that you can specify how long web browsers should keep images, CSS and JS stored locally. That way the user’s browser will download less data while navigating through your pages, which will improve the loading speed of your website.To enable it, add these lines to your .htaccess file.
‘Simply, it gives a deadline when the storage should remove those cache automatically’
—
Done, your page’s leverage browser caching is fixed now. You can check your page’s performance from any speed checker website.
How to Fix Leverage Browser Caching with WordPress Plugin
If you are very concerned about your capabilities of tweaking the .htaccess file, and don’t hire a developer at the same time then you should consider WordPress plugins for doing the job.
These are reliable and put out an almost similar result like manual tweaking ones. Luckily, W3 Total Cache plugin is the most useful & reliable one.
Fixing Leverage Browser Caching in WordPress with the W3 Total Cache can be done by following the steps listed below:
- Install W3 Total Cache WordPress plugin
- Navigate to General Settings and select Enable Browser Cache
- Click save and navigate to Browser Cache Settings (top of the page)
- Choose the cache headers available
- Set expires, cache-control and ETag headers (based on the settings done before)
- Save all settings and refresh your website
You can take a look at the figure to understand the setup part in brief:
FAQ
we found some great question
✍ Can cache be an issue of concern for security in the long run?
Good firewalls, virus scanners and common sense are all you need to keep your machine safe. So, it won’t be an issue of concern in the long run.
✍ If we use the WordPress plugin instead of setting the .htaccess file manually, will I get similar results?
✍ Is it file to delete cached data?
✍ Do browsers cache JavaScript files?
✍ How long does a browser cache last?
response can be cached by browser and any intermediary caches (that is, it’s “public”) for up to 1 day (60 seconds x 60 minutes x 24 hours). Response can be cached by the client’s browser only for up to 10 minutes (60 seconds x 10 minutes).
✍ What is ETag in REST API?
1. Caching and conditional requests.
2. The ETag value can be thought of as a hash computed out of the bytes of the Response body
Final Insight
Leveraging browser cache transforms your newly developed website into a professional one. If you are developing your own website or freelanced to others, must remember/ tell them to include these apache modules to leverage cache & make your webpage the best one in its own sector. Goodluck smart developer.